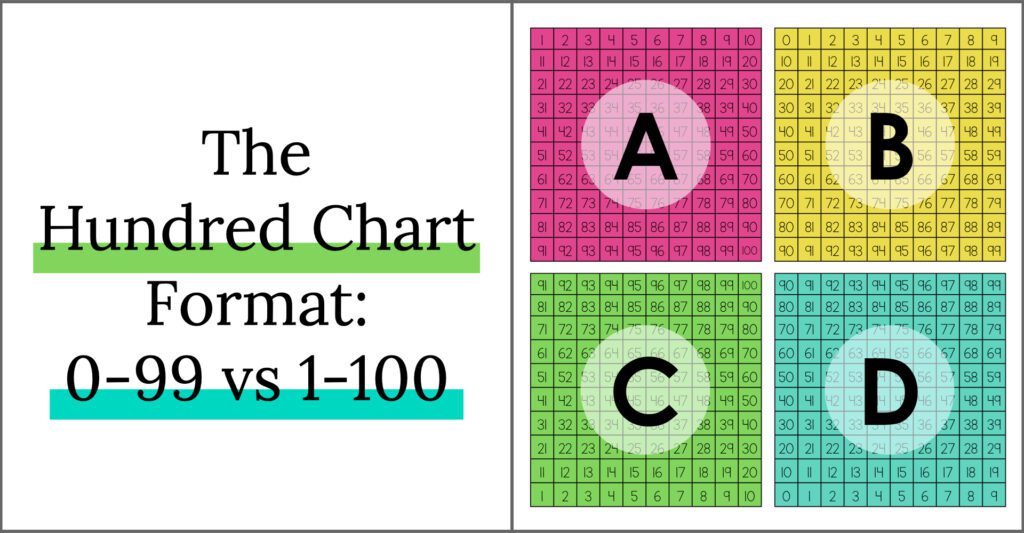
The Hundred Chart is definitely a favorite math tool in most elementary classrooms. However, the format of the Hundred Chart can vary. Today I want to look at four different hundred chart formats and discuss their pros and cons!
How You View the Hundred Chart
How you view the hundred chart will ultimately influence which format you gravitate towards. For example, folks who think of each space of the hundred chart as representing a quantity are very much going to lean towards the representations A and C, where the numbers are represented 1-100. This is because there are one hundred squares, so naturally there the final number should be “100” to illustrated this.
However, if you think of the hundred chart as a number-line that has been organized to fit onto one page, you may be more open to other representations. (I actually have an entire blog post about how I introduce the hundred chart as a number line if you’re curious!)
When you view the hundred chart as a number-line instead of representing quantity, the importance of including zero on the chart shifts dramatically!
Including Zero in Your Hundred Chart Format
When we teach students about counting, we need to remind them that we don’t start on one. Our first jump is TO one, FROM zero. If the zero is not there, we are setting up our students to miss that critical understanding of zero. If we do not include zero, it can also be incredibly confusing when we start to use the hundred chart to support addition and subtraction, since we cannot add from or subtract through zero.
When you start with zero on the hundred chart, you are also setting up for some additional benefits, too.
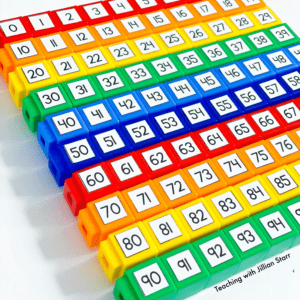
On a 0-99 Chart, one great plus is that each row begins a new decade. That means that every number in a single row has the same amount of tens.
This can be great when representing these numbers with base-ten blocks. It means that we begin each row with only rods, and add units as you move across the grid.
When each row of the hundred chart begins with zero, it also has a great impact how students understand regrouping. When we come to the end of the row, we end with nine ones. In order to move to the next row, we have to add a one and then regroup. This means that the act of regrouping is visually tied to moving to a new row, which can be truly powerful!
Ascending vs. Descending Numbers
I know most folks are used to hundred charts where the numbers descend, meaning it reads from top-left to bottom right. This is often supported by saying that it follows the way students read a page.
However, there are some good arguments to having ascending numbers that I’d like to point out. Ascending numbers naturally shows the correlation between numbers increasing and moving UP the page. For many students the alternative can feel very confusing because they’re counting up, but the numbers are moving down.
Ascending representation also supports many future math skills. Some of these include:
- Data & Graphing
- Coordinate Planes
- Measurement (both height and thermometers)
- Rounding (especially when beginning with zero AND ascending numbers)
Which Hundred Chart Format to Use
Taking all of the pros and cons into account, my preference is Hundred Chart D, where the number range is 0-99 and the numbers ascend from bottom to top. I know it can be hard, especially if you’re worried about keeping tools consistent from one grade level to the next. However, it’s worth having a discussion with your colleagues to weigh the pros and cons together and discuss which you feel will best support your students learning.
After reading this, which hundred chart model do you prefer?


As a grade level we use the top down, starting with one chart, but we use a 120 chart. We noticed that students can struggle with the transition into the hundreds, thus the use of a 120 chart. However, reading this entry makes me think that we not only need to use a 120 chart, we also need to start with zero.
I generally prefer the 0-99 chart, for all of the reasons above. HOWEVER, it’s hard to understand zero as not having a “value” when it holds a concrete place on the board. (Yes, it is a place holder, but…) You can’t point to zero blocks, but you CAN point to the zero on a 0-99 board. You’re pointing to a “thing” that by definition is a “non-thing”. The other issue comes with area of a rectangle. You have a geometric figure which is actually a 10×10 square, which is 100 square units, but there are 99 units and one space, which doesn’t fit the math we are teaching them. Maybe that’s mixing things up too much, but it’s a geometric issue, where you have 100 represented by a square with the corner removed and another little square dangling off the bottom.
My district offered a professional development class based on the ascending 100 chart. I am now a believer.
Definitely! I love going past 100. I actually use a 0-119 chart in my classroom for the reasons that you mentioned 🙂
Hi Laura! Thank you so much for sharing your thoughts. I think that when we are talking about each spot holding value, that’s very different than using the chart as a number line. I teach my students that the hundred chart is a very large number line where we have broken it apart into smaller sections to fit on one page. I think that’s the difference. When we begin teaching geometry, I use tangible pieces for students to count those arrays, and make the clear distinction between each item holding value vs. a variation of a number line. Does that make sense?
I love using a tea-towel with squares on it (any colour combinations) and marked into a grid design 10 by 10 (or 12 by 10) with some masking tape, and then giving my students individual number cards to place on the squares inside the grids to make their own number charts. So interesting to see what they try out and which ones stay ‘safe’ until they see what someone else is doing. I have had students do columns 0-9, 10-19, etc ascending and descending, as well as spirals into the centre and out from the centre. Loved the discussions students had explaining their thinking. I took photos and used them in number chats and as reference charts in the room. I use all four of the charts above and have generated others to 150 to extend student knowledge.
I have never thought of making a chart from a number line starting point – am so going to try that we school resumes for me next week.
That totally makes sense, Jillian. I think the key to changing the view is to make sure that we start with number lines from the very beginning (earlier grades than what I work with) and have a point in time where we make that switch and begin representing the number line as a chart. Literally cut the number line and build the chart together. It’s crucial that they have the number line concept firm in their minds before you make that change. When they come in without that understanding, it is extremely tough to change the concept in their mind. Takes cooperation with all previous classes. Actually, it requires a whole school shift in understanding and presentation. (Much easier said than done!)
I do think that a top-up format is also the best, because it visually matches the vocabulary we use; adding makes numbers go “up”, counting “up” and “down”, etc. Some of my special needs students really struggle when the vocabulary doesn’t match the visual representation
I love this so much, Laura! I definitely agree that it does take thoughtful planning of the prerequisite skills students would need to fully grasp the idea of the number line model of a hundred chart. Thank you so much for bringing it up! Perhaps that will have to be another post 🙂 I love, love, love these conversations because it always makes me think more deeply about how I explain my reasoning and also pushes me to think about how these ideas can be more soundly implemented. THANK YOU!
What a FANTASTIC idea, Elizabeth! I love giving students the autonomy to see what they can come up with themselves! Such a great introduction and way for us to view their thinking.
My daughter just turned 5 and I remember using one of these number grids at school as a kid and went online trying to find one I could “borrow” and print out but couldn’t find a design I liked. I loaded up my spreadsheet and got to work on creating my own.
The Romans don’t have a written form of zero although they do have spoken in the form of “nulla” which means nothing. Strange that they weren’t able to write a number that represented 0. After all, 10 was X, L was 50, C was 100, D was 500 and M was 1000 so in one sense, they had 0 covered. The just couldn’t write 0 on its own.
This got me thinking and I ended up making my own chart 10×10 starting from 0 and getting to 99. This was the first time I ever saw one 0-99 and straight away I noticed several patterns. Left half round down and the right half round up. Each matching double digit number (eg. 11, 22, 33, 44 etc.) the vertical and horizontal rows are the same numbers but flipped and more. To me this grid makes so much more sense than 1-100.
Imagine a fence – you may have the number of fence panels but you always have +1 posts because you’ve got to start at 0!
I can’t wait until she goes back to school with this new number grid so I can find out what her teacher thinks.