Knowing how important multiplication fact fluency is, I decided to share what might be a controversial take on the multiplication chart in third grade. Are you ready?
I don’t recommend posting a multiplication chart or poster until the last quarter of 3rd grade.
I know, I know. There are lots of third grade classrooms with adorable, bright, well-made multiplication charts up on the first day of school but let me explain why I suggest waiting to post it until the end of third grade (at the earliest) and three ways for students to determine products without the help of a chart.
Conceptual Understanding of Multiplication
Conceptual understanding is the reason I suggest holding off on posting a multiplication chart in third grade. Although third graders may have previewed multiplication at the end of second grade, those very basic introduction lessons are often at the very end of the year and it’s very common to run out of time. Moreover, it’s the end of the year and students have a full summer break right after those lessons. The chances that students internalize those concepts can be low.
So, the third grade year is crucial for students to nurture and solidify their conceptual understanding of multiplication. In fact, not only do the third grade Common Core State Standards state that students should be fluent with multiplication and division facts within 100 by the end of the year but another major cluster of standards is focused on the conceptual understanding of multiplication and division. Learning multiplication facts is much more than just memorizing products.
For students who are supposed to be focused on learning the meaning of multiplication, including interpreting the product of 3 and 5 as 3 groups of 5 objects, having a posted visual of 3 x 5 = 15 can derail the process. It can be very tempting for students to glance up at the multiplication chart on the wall to find the product rather than taking the time to “interpret” the product.
Another example of how a student might interpret the product of 4 and 6 would be as 4 desk groups, each with 6 students. Rather than just focusing on the product, the student is considering a contextual representation of 4 x 6 which they can then use to find the product. Encouraging this contextual interpretation is pivotal in building multiplication fact fluency. Until students have mastered this conceptual understanding of multiplication, providing tools that prioritize answers over the process can prove counterproductive.
I do want to clarify that I do think a multiplication chart can be a helpful tool! By the end of third grade, students should be fluent with multiplication facts within 100 so that they are prepared to tackle multi-digit calculations in fourth grade. Without this fluency, those more complex calculations are much more arduous for students. Therefore, I do think that offering students a multiplication chart as a tool when the focus is not on learning multiplication facts can be very helpful.
Assessing and the Multiplication Chart
When assessing students, it’s important to provide them with the tools they have been using successfully in order to accurately show what they have learned. One question I always ask myself when deciding what tools students will need access to is, “What am I actually assessing?”
If I am assessing whether students have strategies to find the product of two factors within 10, access to a multiplication chart will not provide me with accurate data. While some students will ignore the chart, others will simply use it to answer the questions only demonstrating their ability to use a multiplication chart.
However, what if students have access to manipulatives and space to make drawings? If students were to draw 6 groups of 7 to accurately find a product of 42 or use cubes to make 4 rows of 8, would I get an accurate measure of strategies they used to find a product? Yes! When students create groups of drawings, arrays, and area models, they demonstrate their understanding of multiplication. That is exactly the kind of thinking we want students to be doing and demonstrating.
On the other hand, if we are assessing whether fifth graders can use the standard algorithm to multiply two three-digit numbers, will providing them with a multiplication chart give us an accurate picture of whether they are able to do that? I believe so. In this case, we are not assessing whether they can find a product within 100 or 144.
Instead, we want to know if they are able to use a specific procedure to multiply multi-digit numbers. Through the work that students show, we will be able to see if they know the procedure and are able to use it successfully. Simple multiplication math fact errors are not the most important data point in this case. Therefore, providing a multiplication chart can help students to focus on that assessment’s primary goal.
Grow Fact Fluency without the Multiplication Chart
With these considerations in mind, let’s explore alternatives to the multiplication chart to support growth with multiplication fact fluency for your third graders:
Manipulatives
I am a big proponent of providing students with manipulatives at any time during instruction and practice. When working on multiplication some of my favorite math manipulatives are square tiles, Legos, and Omnifix cubes but today, I want to add Cuisenaire rods to that list.
Cuisenaire rods are a set of rectangular rods. Each rod is a different color and corresponds to a different value from one to ten. They are not notched like base ten rods are so the value of each rod cannot be counted, but they can be composed using smaller rods. Cuisenaire rods can be used to model addition, subtraction, and even fractions, but I think they are really amazing for creating area models to model multiplication and division. Because they cannot be counted, it forces students to use other number sense strategies for finding products. It allows students to harness the rods effectively, bridging area models and more abstract strategies.
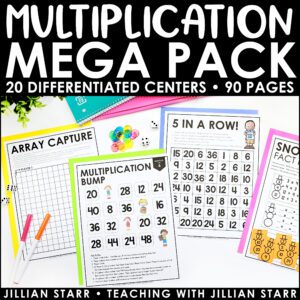
Multiplication Mega Pack
Pictures
Encouraging students to draw pictures when working on finding products or missing factors is invaluable. Students may draw “groups of” pictures or arrays. A “groups of” picture for 6 x 7 may look like 6 larger circles with 7 smaller circles inside. Students could then count, use repeated addition, or some other number sense strategy to find the product. An array for the same expression may have 6 rows of 7 small circles or squares. Again, students would use a strategy to determine the product. Because of how easily accessible paper and pencil or a whiteboard and marker are, pictures are often a great option for students.
Repeated Addition, Skip Counting, and Number Sense Strategies
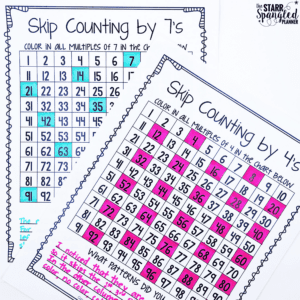
Repeated addition and skip counting are other ways to find the product of two numbers. Students who understand multiplication as repeated addition will easily use this abstract strategy to find a product. Skip counting is essentially repeated addition and is another approach. While we eventually want students to move on to more sophisticated strategies, many students are successful with these approaches. However, students are prone to making computational errors when using these approaches which is where number sense strategies come in.
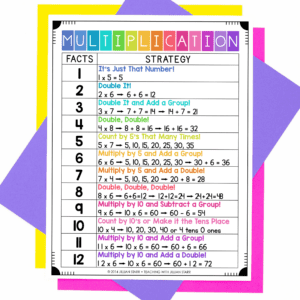
Number sense strategies involve decomposing factors or using benchmark equations to calculate products. For example, when solving 6 x 7, a student may decompose the 7 into 5 and 2 to solve 6 x 5 and 6 x 2. They would then add those two partial products. To solve the same problem using a benchmark, a student may use 5 x 7 and then add another group of 7. By limiting the number of calculations, students can be more accurate.
How students use these tools and strategies will depend on the problem they are solving. Mastery of the 1 and 10 facts often happens quickly. Similarly, when multiplying by 5, most students feel comfortable skip counting by 5s. Therefore, they will not need to draw any pictures or use manipulatives for these facts, while more challenging facts require deliberate selection of the appropriate tool or strategy. This kind of thinking and work is essential for moving students from simply following steps to truly thinking deeply about and understanding multiplication.
Delaying the introduction of the multiplication chart in 3rd grade allows students to develop a conceptual understanding of multiplication. This understanding fosters multiplication fact fluency. While a multiplication chart can certainly be a helpful tool later, focusing on building a solid foundation of multiplication understanding will serve students well as they progress on their mathematical journey.

